This is the story of one my biggest projects in Tableau and Python using AWS.
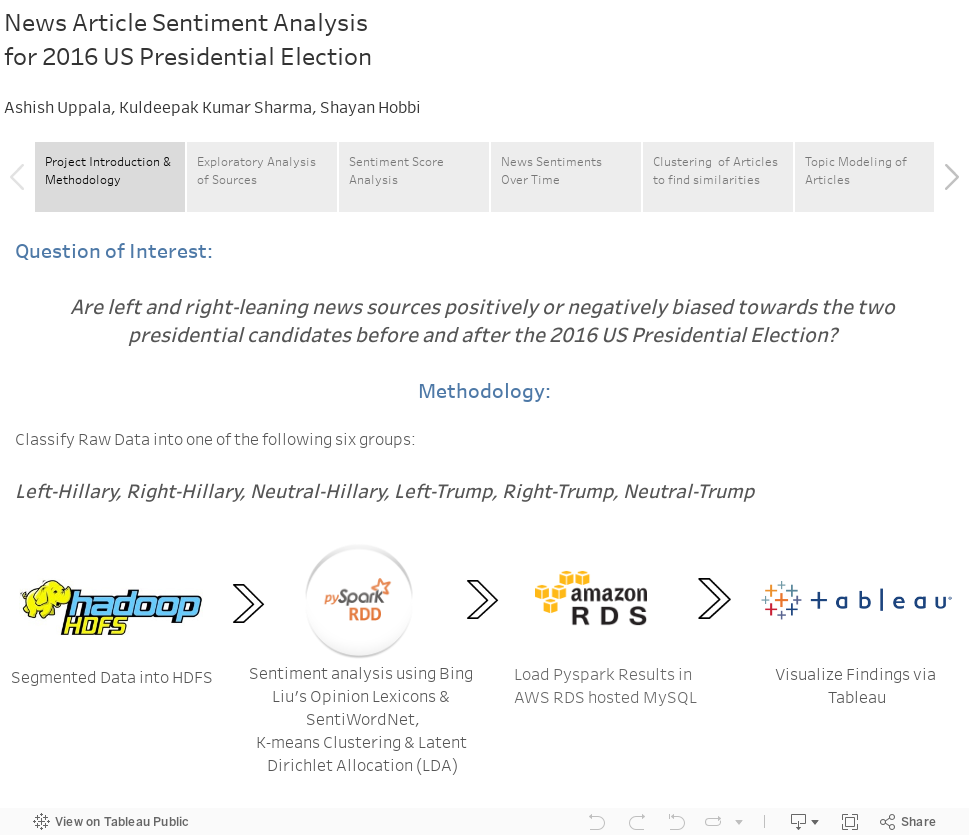
I had the opportunity of working with two brilliant minds in my colleagues, Ashish Uppala & Shayan Hobbi. We created this project for our Big Data class, and while looking for our project topic, we came across this rather amazing data set of upwards of 500,000 news articles from the top 1,000 news sites (based on Alexa rankings) in the US, so we wanted to see what role did these news sites play in the US Presidential Elections.
Of course, such big data needed tools and techniques to run analysis on. So we mined these articles into a local Hadoop instance, where we used PySpark to apply sentiment analysis, clustering, Topic modeling and other machine learning methods to derive insights that we were looking for.
But, the results themselves were big, and so utilized the AWS RDS Mysql instance to store our results.
Previously, I had used Tableau standalone, i.e. to publish stuff, but this time I took it upon myself to completely present our presentation on Tableau using the Tableau Story feature.
My inspiration for this Tableau visualization was similar work on Twitter Sentiment Analysis by Alexander Loth, the famous Tableau guru.
Do check out my Tableau viz below and share your feedback.
Ciao!!
Comments
Post a Comment